Tuesday, October 20, 2015

UF Dashbuilder - Real-time dashboard with ElasticSearch & Logstash


This article is about a new Dashbuilder's feature for consuming and visualizing data stored in an ElasticSearch server. ElasticSearch (aka ELS) is a noSQL storage, indexing & search service that provides a distributed, multitenant-capable full-text search engine with a RESTful web interface and schema-free JSON documents. If you want to learn more about it, please visit the ElasticSearch home page.

Dashbuilder is a web based tooling that eases the process of building dashboards . As you might know, Dashbuilder provides a simple API that allows to integrate with any external storage system: the Data Provider API.  Since latest 0.3.0.Final release, Dashbuilder adds another data provider for the Elastic Search integration, along with the already existing CSV, SQL and Bean providers. This new one provider allows the users to consume unstructured data from an ElasticSearch server instance at real-time. So you can abstract the data stored in your ELS into a data set structure, and then use all the Data Set API features and power to create your visualizations, as can be done with any of the other data providers available.

The following sections will give you a quick overview of the ElasticSearch integration features. At the end of the article you will also find a tutorial that shows how easy is to integrate Dashbuilder with an ELS server, or as in this example, with the ELK stack, providing an step-by-step tutorial for the creation of a real-time system metrics dashboard. (You can skip the first part of this article if you are only interested following the the tutorial).

The tutorial's resulting dashboard


The ElasticSearch data provider


Overview

The main goal for the Elastic Search data provider is to consume unstructured data from an ELS index and generate a resulting structured data set, which can be used along the application to create your visualizations and dashboards.

Elastic Search Data Provider overview
As you can see, Dashbuilder communicates with the server instance using the RESTFul API provided by ElasticSearch. It allows an easy integration as the protocol used for the communication is the  HTTP/JSON one, which has lots of already well known advantages, such as providing data in an easy and human readable structure, skipping the needs for firewall configurations, etc etc.

Key concepts

In order to consume data from an index stored in a ELS server, the data provider needs a set of mandatory attributes that describe where and how to find and consume it. These attributes are defined by the user and stored in a structure called Elasticsearch Data Set Definition. The minimal attributes to set in order to consume data from an ELS instance are:

AttributeExampleDescription
Server URLhttp://localhost:9200The server URL for your ELS RESTFul API services
Cluster nameelasticsearchThe name of the cluster in the server instance
IndexexpensereportsThe name of the index to consume
Type/sexpenseThe document type/s to consume for the given index

Once a data set definition is created, Dashbuilder is able to process data lookup calls against the ELS instance and generate a resulting data set, so finally the users can create their visualizations and dashboards using the remote data.

Another important key point about turning ELS unstructured data into structured data sets are the data set columns. ElasticSearch provides its own core data types that are implicitly bind to data set columns by the ELS data provider.

Data columns binding from an index mappings

The data columns binding is done automatically by the application when creating a new ELS data set definition. It binds the field name, data type, format and patterns from an ELS index mappings into data set columns with a given name, data type, format and pattern as well.

A detailed documentation about how column binding works and other cool features can be found at the ElasticSearch data provider documentation.

Real-time system metrics dashboard

This section is intended to be an a step-by-step tutorial that will show you how to define and consume data from an ELS server instance and use it to create your visualizations and dashboards from scratch.

As you will see in this tutorial, it's really easy to create data set definitions, visualizations and dashboards in Dashbuilder. This demo is intended for non-technical users, as there is no need for coding or having high level technical skills. In a few mouse clicks you will be consuming your ELS data and creating dashboards! :)

Let's see the scenario used for this tutorial and then we will deep into each workflow step for achieving a real-time system metrics dashboard.

Scenario

The main goal for the system metrics dashboard is to be able to consume and visualize different metrics that come from different computers at real-time.

For this tutorial we have used a well known system metrics reporting and storage environment provided by the collectd daemon and the ELK stack. We decided to use this scenario as it's really easy to setup and you can find lots of documents and articles on the net about it. The main difference with the other tutorials based on the ELK stack is the use of Dashbuilder as the monitoring web application instead of Kibana.

The following diagram describes the environment used in this tutorial:

System metrics scenario
As you can see, the scenario consists of:

  • Two computers to be monitored - Computer A & Computer B
  • The main server that provides:
    • An instance of Logstash server
    • An instance of an ElasticSearch server
    • The Dashbuilder application
  • A single client that consumes the dashboard/s
The overall workflow for this scenario follows these steps:

  1. Collection and transmission of the system metrics
    Both computer A and computer B have the collectd service running, which captures some of the system metrics and send these ones over the local network using TCP and UDP packets
  2. Process and storage of the system metrics
    The collectd resulting packets from both computers are processed by the Logstash server and  sent to ElasticSearch, responsible for storing all the metrics data in a given index
  3. Consume and visualize the system metrics
    Once the client that consumes the dashboard needs to retrieve some metric data, Dashbuilder application performs all the data look-up operations against the ELS storage server, producing the resulting data sets that feed your dashboards and visualizations.
NOTE: In this tutorial, the Logstash server has been configured to store the logs into an index named logstash-logs in the ELS instance, and is not the default one used by Logstash in a clean installation.
Once having this or a similar scenario, we are able to consume the computer metrics from the ElasticSearch server and benefit from all Dashbuilder's features.

Keep in mind that Dashbuilder only worries about the ELS server data, it does not care how metrics are collected, processed or transmitted. This means you can store the metrics in any storage supported by Dashbuilder.

Metrics data

Using collectd for generating the metrics provides a huge flexibility and power as it's really easy to install, configure and it supports lots of plugin and metrics. Consider that these metrics are captured by the Logstash server, which process and finally stores each one into the ELS server. So here is the list of fields in the generated logstash's index for each metric that will be consumed by the tutorial:

Field nameDescription
@timestampThe timestamp for the metric
host.rawThe hostname that produces the metric (the ".raw" indicates that we are using a multi-field for the host field in the index, for the logstash generated index, it contains the not_analyzed value of the hostname)
pluginThe metric plugin (cpu, memory, df, processes, interface)
plugin_instanceThe instance for the metric for a given plugin
type_instanceThe type for a given metric (cpu used, cpu free, etc)
valueContains the concrete value for the given metric and type
rxContains the network packets received in the given interval
txContains the network packets sent in the given interval

Here you can find more information about the collectd plugins and metrics and the collectd input plugin for Logstash.

Let's deep into the step-by-step creation of the system metrics dashboard!
  

Step by step tutorial

Once described the environment and the metrics to be consumed, let's start the tutorial for creating a real-time system metrics dashboard using Dashbuilder.

The result of this tutorial is given by a simple three step workflow:

Considerations:
  • Dashbuilder web application running at http://localhost:8080/dashbuilder
  • ElasticSearch server RESTFul API available and running at http://localhost:9200
  • Consider the logstash for the ELS cluster name.  
  • Consider logstash-logs as the index generated by logstash in the ELS server which contains all system metrics data

Step 1 - Create the data set definition

Let's create the definition for our metrics data set.

This tutorial describes just the minimal configuration required for generating a data set with all metrics stored in the ELS server's index. It does not deep into the use of data set filters, column types modifications or advanced attributes and features. Just try and play yourself with it! ;)

At Dashbuilder web application's home click on Authoring -> Data Set Authoring item on top menu:

Data set authoring menu item 
Once at the data set authoring perspective, click on New data set button provided in the data set explorer view:

New data set button
On the center area of the data set authoring perspective appears a data set creation wizard. First step is to select the data provider type, for this tutorial select the ElasticSearch one and click on Next:
Data provider type selection screen
Next screen is the ElasticSearch data provider configuration, use the configuration values from your scenario and click on Test button:

Data provider configuration screen
At this point, the application is able to communicate with the ELS server and retrieve the mappings for the index and some preview values:

Data provider configuration and data set preview screen
At this screen you can add or remove the data set columns, modify their column types, specify an initial data set filter, and configure more advanced features at the Advanced tab.

As commented, this tutorial describes a minimal configuration for creating the data set definition, although is not the best implementation for real production usages.

Tips:
  • Just select the columns for your needs
  • Modify column types for your needs
  • Add initial filters when consuming the data set from several indicators
  • Consider data set refreshing
  • Do not create just one data set definition for your metrics indicators, create different ones for different metrics and hosts. 


As for this tutorial, just click on Save button to store your data set definition and make it available for creating the dashboard's visualizations.

After save, you should see the new "All system metrics" data set definition in the explorer's list:
Data set explorer view
Now you can create new visualizations and dashboards using the All system metrics data set, let's go for it!

Step 2 - Create a dashboard

To create or navigate through the existing dashboards, use the Dashboards top menu item.

Click on Dashboards -> New dashboard:

Dashboards menu
And set a dashboard name on the popup screen:

New dashboard popup
Once a name is typed, press Ok and an empty dashboard appears.

At this point you can create as many displayers as you need, but before starting to create the displayers, you first should think about what you want and what you need.

For this tutorial consider the resulting dashboard's displayers and layout used as the following picture describes:

Displayers and layout for the dashboard
As you can see:

  • The dashboard will have 5 displayers
     
  • On left side it will have 3 metric displayers to show current memory, cpu and disk usage
     
  • On right side it will have an area chart (memory used in last minute) and a pie chart displayer (to show the current servers that are up and running)
     
  • All displayers will have the refresh feature enabled, using a one second interval, in order to display the real-time metrics
     
  • All displayers will show the average value for each metric, as several hosts can be present at same time
     
  • As you will see in the video, the metrics in real environments usually come with some delay produced by network latency, processing times, etc. So all displayers have a time frame filter to avoid this latency on the charts - for this environment we chose a time frame as:

                                               now -7second till now -3second

    Considering a maximum delay of 3 seconds for the metrics, and showing last 4 seconds of data for each one.

Next section describes how to use this popup for creating several displayers and have them created in your dashboard, so keep reading! ;)

Step 3 - Create the visualizations

This section explains how to create the displayers for this concrete dashboard, but it does not deep into details about the displayer editor popup and its usage, as this component has been already explained in this previous article.

In order to create a new displayer just click on the New displayer button on right side of the top menu:

New displayer button
The displayer editor popup appears as:

Displayer editor popup

This screen has three tabs, in order to configure the displayer type, the source data and other display related properties.

Displayer 1 - Memory usage metric displayer

Let's create our first displayer - a memory usage metric displayer using the following configuration:

Memory usage metric displayer configuration


  • On tab type, select type Metric
     
  • On tab data, specify the just new created "All system metrics" data set and add the filters (see  the above diagram). The filter configuration should look like this: 
Filter configuration

  • On same tab data, set the metric to display using an average function as:
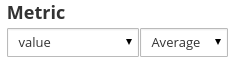
Data set column to display using the avg function

  • Move to display tab and set a title for the chart:
Displayer title


  • In order to display the value in Gb, go to the Columns section and use the following values for the column attributes:
Column configuration

NOTE: For the expression attribute use value / 109 , and for the pattern attribute use #.##  in order to show the input values in Gbytes
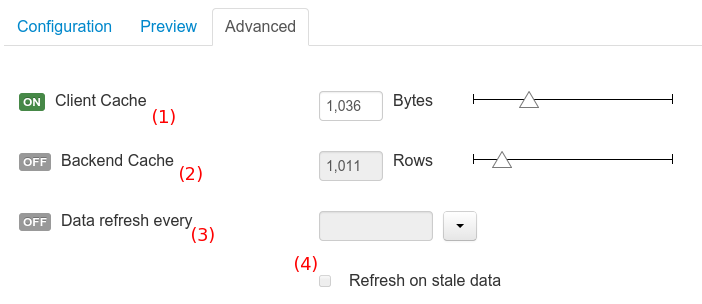
  • On same display tab, open the refresh section and enable it using a 1second interval:
Refresh data every second


Once the configuration is finished just click the Ok button and the new displayer will be dropped into the dashboard layout:


Memory used metric displayer

As you can see, you can create as many displayers as needed and drag&drop them into different dashboard areas. Just click the mouse-left button on the displayer panels's header and drag&drop it into the desired layout's region, when the compass control appears:

Move your displayers inside the dashboard

For the next dashboard's displayers, the creation workflow is similar, but just applying the different values on filters and columns. Here is the quick summary of their configuration:

Displayer 2 - CPU usage metric displayer

1.- Apply filters and columns values as:

CPU usage metric displayer configuration
2.- Set a title for the chart and enable the refresh feature using an interval of 1second

3.- There is no need to change column patterns as the values already are in percentage format

Displayer 3 - Free disk space metric displayer

1.- Apply filters and columns values as:

Free disk space metric displayer configuration
2.- Set a title for the chart and enable the refresh feature using an interval of 1second

3.- Apply same column configuration (expression & pattern)  as the displayer 1.

Displayer 4 - Memory usage displayer using an area chart

1.- Apply filters and columns values as:

Memory usage area chart configuration
2.- Set a title for the chart and enable the refresh feature using an interval of 1second

3.- Apply same column configuration (expression & pattern)  as the displayer 1.

Displayer 5 - Servers pie chart

1.- Apply filters and columns values as:

Server pie chart configuration
2.- Set a title for the chart and enable the refresh feature using an interval of 1second

Video

In order to show the system metrics dashboard in action, here there is quick video that shows how to create some displayers, apply the configurations and move them inside the dashboard areas for generating the final layout.

The environment used for this tutorial was:

Environemnt used for the tutorial

Also consider that the metrics data is coming from two different servers (under our control), so we can start, stop and stress them producing the real-time data being monitored by the dashboard.

To avoid long videos it starts with the data set definition, the dashboard and some displayers already created and configured.


Wednesday, June 3, 2015

UF Dashbuilder - Data set authoring

This article introduces the new Dashbuilder's Data Set authoring user interface which allows the user to list, create, update and remove data sets from a web browser. Please note that it's an end-user oriented guide, so do not expect to deep into technical details.

A Data set is one of the main components in Dashbuilder's architecture; all of the different visualizations use Data sets to get the data they need. So if you are not used to the Data set API & architecture, it's high recommended reading this previous article.

Consider the Data set authoring as the name given to the web interface that provides a set of screens to manage your Data sets in a user friendly way. In the following video you can get a quick preview of how the new interface looks like (do not forget to select HD) and how easy is to register a new data set.

Data Set authoring perspective

Note: given that point, the use of this authoring perspective gives the user a new and much more easy way for managing Data sets than the default deployment scanner (See section Data set deployment in this article).

Refreshing some concepts ...

To be able to create and edit data sets it's important to get used to the Data set API and some other concepts. This is a quick review (all details in this previous article).

(If you are already familiar with the Data set API & concepts you can skip this section)

Data set & Data set definition


The most obvious should be assuming that data set authoring is about the management of  data sets, so the underlying model should be a data set. Is it...? Almost true.. but strictly speaking it does not allow the management of Data set instances, it allows the management of Data set definitions.

Remember that a Data set definition is just the representation of a Data set attributes and columns. It provides the information for being able to look up information from remote systems , collect and perform data operations, resulting in Data sets. If looking deeper in the architecture, the definition is a persistent entity that uses the JSON exchange format. Thus you can consider the Data set authoring as a web interface editor for JSON Data set definitions.

Data set definition class members:
  • A name and unique identifier (UUID)
  • A type. It defines the storage type that provides the remote data to be consumed.
    Currently the editor supports BeanSQL, CSV and ElasticSearch types. These types allow for  looking up data from a Java class, a DBMS, a CSV file or an ElasticSearch storage system respectively.
  • Specific attributes. For example, if using an external DBMS the JDBC url and connection credentials are mandatory user input attributes.
  • Data columns. Define which columns will be present in the Data Set when a look-up is performed. See next section Data columns.
  • Initial data filter. Minimize the look-up result size by providing a filter. 
  • Cache and refresh settings. Some other attributes related to client & backend cache sizes and the data refresh policy.

Data columns

Data columns are the name used for the columns of the resulting data set when a look up is performed.

A data column have a unique identifier for the column in the data set and a data type. Dashbuilder supports 4 column types:
  • Number -  The row values for the column are considered numbers, so you can use the column for further column functions use (sum, min, max, average, etc).
  • Date - The row values for the column are considered dates, so you can use the column for further column date related functions (timeframe, intervals, etc)
  • Text - The row values for the column are considered plain text. The column cannot be used in any numeric functions neither cannot be grouped (this column will be never indexed in the internal registry).
  • Label - The row values for the column are considered text literals. The column can be grouped as the values are considered concrete. 
No matter which remote system you want to look up, the resulting data set will return a set of columns of one of the four default types above. So there exists, by default, a mapping between remote system column types and the Dashbuilder's types. The user is able to modify the type for some columns, depending on the data provider and the column type of the remote system.

The data set authoring perspective allows the data columns manipulation as you will see in the next sections.


Initial data filter

It's important to remember that a Data set definition can define a filter. It's named initial data filter as it is present in the definition of the data set itself, so all further data displayers and other components that use this definition will be using the subset of data that satisfies the filter conditions.

The goal of the initial filter is to allow for removing  from the data those rows that the user does not consider necessary. The filter works on any data provider type.
Note: For SQL data provider type, you can use both initial filter or just add custom criteria in the SQL sentence. The first is more appropriated for non technical users since they might not have do the required SQL language skills.
So it's important to note that you can specify a data filter at two levels:
  • In a Data set definition
  • In a Data displayer definition
Having in mind that a Data displayer consumes data from a Data set, there are some implications when deciding at which level specify the data filter. For instance, you may have a data set getting the expense reports only from the London office, and then having several displayers feeding from such data set. Another option is to define a data set with no initial filter and then let the individual displayers to specify a filter.  It's up to the user to decide on the best approach. Depending on the case might be better to define the filter at a data set level for reusing across all the displayers.  The decission may also have impact on the performance, since a filtered cached data set will have far better performance than a lot of individual non-cached data set lookup requests per displayer (cache settings are described at the end of the article). 

The authoring perspective

Once familiarized with the API and some other basic concepts, let's see in detail the authoring perspective, its components and the main use cases of the tooling.

The Data set authoring is the name given to the web interface that provides a set of screens to manage your Data sets in a user friendly way.

You can navigate to the perspective at Main menu -> Authoring -> Data Set authoring:

Data Set authoring menu item
The following screenshot shows the perspective screen:


Data Set authoring perspective
This view defines two panels/sections: the Data set explorer and the Data set editor
  • Data set explorer
    It allows the user to explore and remove current system data sets. See next section Data set explorer.
  • Data set editor
    It allows to create, read or update a data Set. See next section Data set editor

Note: For more information about UberFire perspectives and how to use them, please take a look at the official documentation.

Data set explorer

The Data Set explorer is a client side component with the main goal listing all public data sets present in the system and let the user perform authoring actions.

Data set explorer
It provides:
  • (1) A button for creating a new Data set.
  • (2) The list of current available public Data sets.
  • (3) An icon that represents the Data set's provider type (Bean, SQL, CSV, etc)
  • (4) Details of current cache and refresh policy status.
  • (5) Details of current size on backend (unit as rows) and current size on client side (unit in bytes).
  • (6) The button for creating, reading or update a Data set. Its behavior is to open the Data set editor for interacting with the instance.  
  • (7) The button for removing a Data set.

Data set editor

The Data set editor is a client side component that allows the user to create, read or update a data set.

Data Set editor home screen
The user interacts with the editor by:
  • Clicking on Edit button in Data Set explorer
  • Clicking on New Data Set button in Data Set explorer
  • Clicking on New data set link in Data Set editor's home screen


Basic creation & edition workflow

The interaction with the editor for both create and edit goals is given by a given workflow with three steps:

Data Set creation & edition workflow
  1. Data provider type selection

    Specify the kind of remote storage system (BEAN, SQL, CSV, ElasticSearch)
     
  2. Data configuration - Basic and provider type's specific attributes edition

    Specify the attributes for being able to perform the look up to the remote system. These attributes vary depending on the Data provider type selected on previous step.
     
  3. Advanced configuration - Table preview & Edition of data set's columns, initial filter, caché and refresh settings

    Configure the structure, data and other settings for the resulting data set.

Workflow step 1 - Type selection

Allows the user 's specify the type of data provider for the data set to create.

The screen lists all the current available data provider types and helper popovers with descriptions. Each data provider is represented with a descriptive image:
Data provider type selection screen
This screen is only present when creating a Data set. It's not allowed to modify the Data set's provider type for an already existing data set.

Four data provider types are currently supported:
  • Bean (Java class)
  • SQL
  • CSV
  • Elastic Search
Once a type is selected, click on Next button to continue with next creation workflow step.

Workflow step 2 - Provider specific attributes

Once specified a kind of storage to look up in previous step, the next one is the configuration of the specific attributes to use it.

The following picture shows the configuration screen for an SQL data provider type:
New SQL Data set creation screen
Once data set name and connection attribute inputs are filled, for this SQL specific case, click on Test button to perform a initial connection to the source SQL storage. This process will fetch a small set of data and continue to next workflow step.

Similar use for other data provider types:

BEAN Data set type
CSV Data set type
Elastic Search Data set type
Notes:
  • The UUID attribute is a read only field, for further use in remote API or specific operations, as it's generated by the system, but you cannot edit it.
  • You can go back to the configuration tab at any time while creating or editing a data set, but if you modify any value on this tab inputs, you have to click on Test button to apply your new changes and perform a new look up. Doing that, you will lose any columns or filter configuration, as the look up result can have different data and/or structure.  

Workflow step 3 - Data set preview and advanced settings

At this point, the system is able to perform a look up to the remote system and return a data set. In this workflow's step you can check your result data and customize the structure and the rows for your own interest.

This step is presented by using the screens of the Preview and Advanced tabs:

Preview tab

As you can see there are three main sections in this screen:
Preview tab
This tab contains three sections:

Data set preview

A data table is located in the central area of the editor screen. This table displays the data that comes back from the remote system look up process.

Data set preview


You can apply some operations on this table such as filtering and sorting.

Data set columns

You can manage your data set columns in the Columns tab area:
Data set columns

Use the checkbox (1)  to add or remove columns of the data set. Select only those columns you want to be visible and accessible to dashboard displayers.

Use the drop down image selector (2) to change the column type. This have some implications on further column operations, as already explained on previous sections.

Note: BEAN Data provider type does not support changing column types as it's up to the developer to decide which are the concrete types for each column.

Data set filter

In the Filter tab area you can specify the Data set definition initial filter:

Data set filter

While adding or removing filter conditions and operations, the preview table on central area will be updated with the new subset of data.

Note: The use of the filter interface is already detailed in this previous article.

Advanced tab

Last settings to configure for a Data set definition are present in the Advanced tab:

Advanced settings tab
In this screen you can specify caching and refresh settings. These settings are very important for making the most of the system capabilities thus improving the performance and having better application responsive levels.

At (1) you can enable or disable the client cache for the Data set and specify the maximum size (Bytes).

At (2) you can enable or disable the backend cache for the Data set and specify the maximum cache size (expressed in data set's rows).

At (3) you can enable or disable automatic refresh for the Data set and the refresh period.

At (4) you can enable or disable the refresh on stale data setting.

Let's dig into more details about the use of these settings on the following paragraphs (it's recommended the previous reading of this article as it introduces the basics concepts behind Caching&Refresh).

Caching

Dashbuilder is built with caching mechanisms for holding data sets and performing data operations using in-memory strategies. The use of these features have lots of advantages, as reducing network traffic, remote system payload, processing times etc. In the other hand, the user is responsible for the right use of caching and their sizes to avoid hitting performance issues.  

Two levels of caching are provided:

  • The client cache
  • The backend cache
The following diagram shows how caching is involved in any data set look up, group, filter and or sort operations:

Cachés
Any data look up operation produces a resulting data set, so the use of the caching determines where that lookup operation is executed and where the resulting data set is located.

Client cache

If ON then the data set coming from a look up operation is pushed into the web browser so that all the data displayers or other components that feed from this data set do not need to perform requests to the backend, everything is resolved at a client side:

  • The data set is stored in the web browser's memory
  • The related displayers feed from the data set stored in the browser
  • Grouping, aggrtegations (sum, max, min, etc), filters and sort operations are processed within the web browser, by means of a Javascript data set operation engine.

If you know beforehand that your data set will remain small, you can enable the client cache. It will reduce the number of backend requests, not only the requests to Dashbuilder's backend, but also the requests to your backend storage system.  On the other hand, if you consider that your data set will be quite big, disable the client cache so as to not hitting with browser issues such as slow performance or intermittent hangs.

Backend cache

It's goal is to provide a caching mechanism for data sets on backend side.

This feature allows to reduce the number of requests to the external storage system, by holding the data set in memory and performing group, filter and sort operations using the in-memory engine.

It's useful for data sets that do not change quite often and their size can be considered acceptable to be held and processed in memory. It can be helpful if the remote system network connection bandwidth has high latency. On the other hand, if your data set is going to be updated frequently, it's better to disable the backend cache and perform the requests to the external system on each look up request, so the external system is responsible for executing group, filter and sort operations using the latest data.

NoteBEAN and CSV data provider types relies on the backend cache by default, as in both cases the data set must be always loaded into memory in order to resolve any data lookup operation using the in-memory engine. This is the reason why the backend settings are not visible in the Advanced settings tab.


Refresh policy

Dasbuilder provides the data set refresh feature. Its goal is to perform invalidation of any cached data when certain conditions are meet.

Refresh policy settings
At (1) you can enable or disable the data refresh feature.
At (2) you can specify the refresh interval.
At (3) you can enable or disable refresh only when data is out of dated. 
The data set refresh policy is tightly related with data set caching, detailed in previous section. This invalidation mechanism determines the cache life-cycle.

Depending on the nature of the source data there exist three main refresh use cases:
  • Source data changes predictable

    Imagine a database being updated every night. In that case, the suggested configuration is use a refresh interval = 1Day (2) and disable refreshing on stale data (3), so the system will always invalidate the cached data set every day. this is the right configuration when we know in advance that the data is going to change (predictable changes). 
  • Source data changes unpredictable

    On the other hand, if we do not know whether the database is updated every day, the suggested configuration is to use a refresh interval = 1Day (2) and enable refreshing on stale data (3), so the system, before invalidating any data, will check if it has been updated. If so, the system will invalidate the current stale data set and will populate the cache with fresh data.
  • Real time scenarios

    On real time scenarios caching makes no sense as data is going to be updated constantly. In this kind of scenarios the data sent to the client has to be constantly updated, so rather than managing the refresh settings for the data set in the Data set Editor (remember this settings affect the caching, and caching is not enabled) you have to define when to update your dashboard displayers by modifying the refresh settings from the Displayer Editor configuration screen. For more information on Displayer Editor and real-time dashboards, please refer to Dashbuilder Displayer Editor & API and Real time dashboards articles.

Tuesday, March 31, 2015

UF Dashbuilder - Export displayer data to CSV and Excel


Displayer data export demo (select HD)


In short video demo above we demonstrate an interesting new feature that we've just added to dashbuilder, nl. the ability to export a displayer's data set, either to comma-separated-value format, or to excel format. While this is perhaps not a visually very impacting feature, it's without a doubt a very useful one.

The first important thing worth mentioning is the fact that this export can be applied to any type of displayer. In the end a displayer is in fact nothing more than a visual representation of some sort of underlying tabular data, so this is actually quite straightforward.

In the demo we can see a couple of displayers based on some example sales opportunities data. To the left we have a bar chart displayer representing some opportunities by their current pipeline status, and to the right a table displayer with more detailed information about the these sales opportunities. How to create and configure dashbuilder displayers was covered in a previous entry: UF Dashbuilder Displayer Editor & API.

In the first part of the demo you can see how the data export feature can be activated. To do that we have to go to the displayer's actions dropdown and select edit. In the displayer's edit popup window we then move to the display tab where its appearance properties are configured and here, if we open up the 'general' section, we can see 2 new checkboxes have been added for data export, either to csv and/or to excel format. Initially, these checkboxes are set to off, which means that the creator of a displayer has to explicitely enable data export for a specific displayer.

In the demo, a different type of export is chosen for each displayer, and when we return to normal view mode and revisit the actions dropdown, we can see how the new export action has now become now available to us. It's really as simple as that.

The next part of the demo shows how, and this is an important detail, the exported data concerns the currently visualized displayer window, i.e. if the displayer is subject to filtering, as is clearly seen in the demo, the exported data will be filtered accordingly.

That's all, we hope you find this feature useful, please don't hesitate to get back to us with any feedback!

Friday, March 27, 2015

UF Dashbuilder - Real time dashboards

   Dashboard solutions face different scenarios when it comes to data retrieval. While some dashboards do not require frequent updates as the data doesn't change very often or even rarely, other dashboards may require constant updates, because its data changes at a very fast pace. Therefore, we can classify our dashboards into two main groups:

  • Analitics: usually focused on the analysis of information about the past (historical/statistics), or about information that is known in advance (forecasts). The main trait of these dashboards is that data does not change very often and the time frame is usually long. Some examples: A company's sales evolution and forecast, sport statistics in general, etc.

  • Real time: their main trait is that data changes at a very fast pace. Therefore, this requires to update the indicators & reflect the changes in the UI frequently. Usually, the data is bound to a very short time frame, such as the last 10 seconds. Real time dashboards are typically used to monitor critical resources or systems, for example: Health display sensors, IT resources, air traffic control, etc. 

   Here is a comparison table which summarizes the main features of both:

    Analytics  Real-time  
 Data changes very often                                No Yes   
 Time frame    Any  Short   
 Amount of information    Any  Little   
 Dashboard updates  Rarely  Frequent   


  Dashbuilder is a general purpose dashboard solution. One of its design goals is to support both approaches. The following video shows an example of a real time dashboard built using the Dashbuilder GWT Client API (do not forget to select HD). The dashboard contains some metrics about an emulated cluster (the values shown are not real).


Real time dashboard example

   The dashboard is part of the Dashbuilder examples gallery and it's basically a GWT UI binder widget (source code here).

   Not only we allow for creating programmatic dashboards but also for custom ones created by end users. The next video (select HD) is a demo of how to create a real-time dashboard from scratch using the tooling. Here again, we're using the emulated cluster metrics data set, so the values shown are not real.

Creating a real-time dashboard

    As you can see, Dashbuilder covers a wide range of scenarios. As we introduced in this blog entry, data can be extracted from different systems. Once you have the data you can easily create your own visualizations. Both the analytics and real-time approaches are supported out of the box.